Safer boating infographic
Each year Maritime New Zealand surveys over 2000 individuals on their boating habits and routines. These results determine where the department should focus their attention in promoting safer boating within NZ.
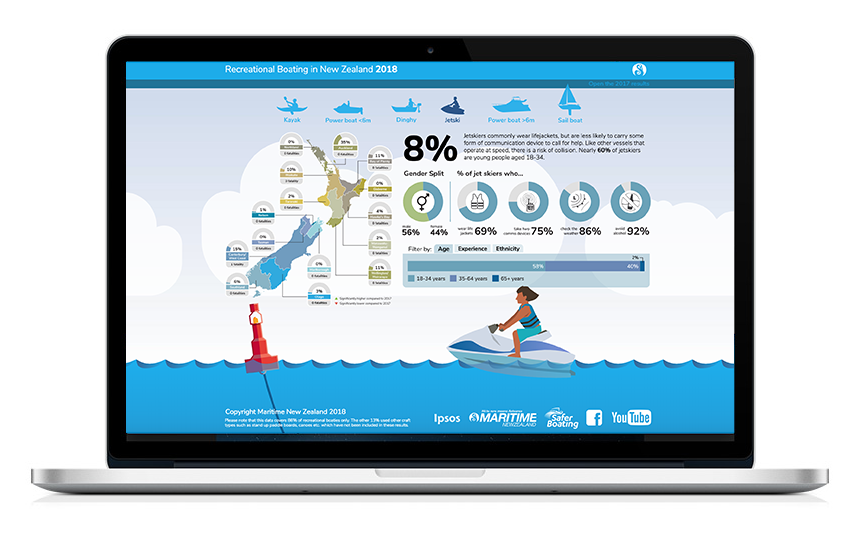
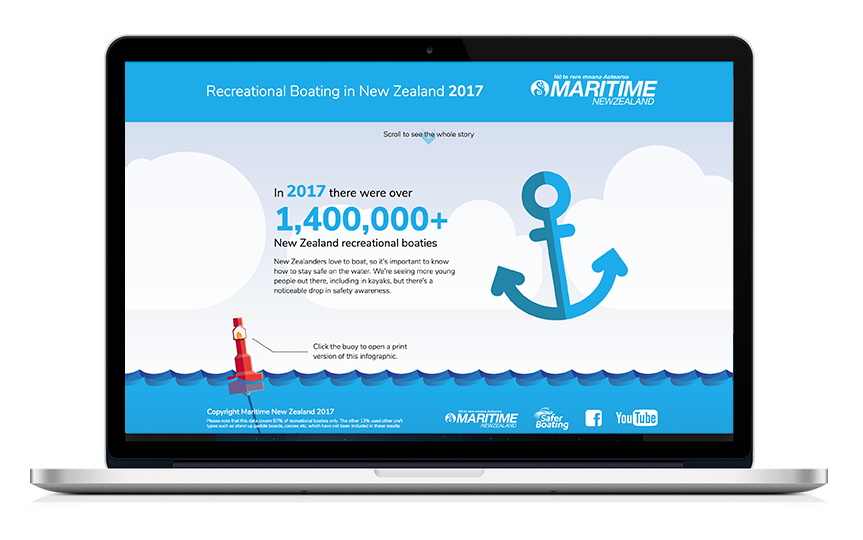
In previous years the report was delivered in PowerPoint, however for the 2017 results it was decided something a little different was required to help bring the data alive and promote the study. The solution was to build a highly interactive parallax scrolling website which would allow the user to interact with different vessels discovering their different data sets.
High level results were introduced at the top level, with visually engaging commentary unfolding as the user scrolls.
Click here to open the latest interactive infographic
Due to it’s popularity the solution was repeated for 2018, and looks to continue on each year.